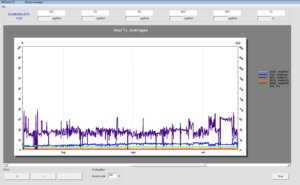
The Data Collection and Processing system is a service of the operational system which will reside in the PC Data Collection Server, with programmable frequency and/or on request of the operator, is capable of updating its database with the one residing in the remote servers at the monitoring stations.
 The Server can be managed by a Client software package installed in the Server, or from another remote operator station connected with the Server via Ethernet network.
The user interface of the entire software package is the same both in the cabin at the remote acquisition PC, at the Server, and at the remote stations. This characteristic makes the use easier and the system characteristics flexible. The interfaces will be furthermore customized based on the specific requests of the Client.
By using the user interface or from the Server, from the operator stations it is possible to assign diverse privileges to the following series of users:
- Configurator user
- Serviceman user
- Operator user
- System administrator
- Other users that can be created by the system administrator
The basic functionalities provided are:
- For control functions via remote PC Anywhere/VNC/Desktop
- Total configurability of the remote cabin station from the Central Server, built via alignment of the databases, and not with telephone/online custmoer service type PC Anywhere/VNC.
- Data processing with visualizations in graphic and chart form of the results.
- Total expandability of the system with the sole access on an Administrator level, to implement additional stations.
- Full compliance with all the norms that regulate the subject matter, in particular, the prescriptions contained in the Ministerial Decree dated May 20, 1991, point 2.4.3. , and the prescription contained in the M.D. dated April 2, 2002, n. 60.
The Data Processing Center software is arranged for:
- Data compensation
- Synoptic frames
- Graphs (pointed, bar, pie, three-dimensional, multiple, and overlapping) on the progress of the compensated size measurements and of the averages
- Acqusition of the maximum and minimum values and their archiving.
- Acquisition of the alarms.
- Visualization of the data acquired and processed by the system on graphic pages which are readily readable and which can be customized for the system.
- Real-time visualization of the all the system inputs, also on programmable strip charts and pseudo-indicators
- Configuration of all the measures being acquired through guided pages.
- Data registration with capability to store at least 40 years of data in archive.
- Visualization and print-out of each parameter of the elementary data, averages per minute, half-hourly averages, hourly averages, daily averages, daily maximums and minimums, monthly averages, weekly averages, alarm history, adn calibration reports.
- Visualization and print-out of each parameter of the graphs over several observation periods, for an immediate comparison of the measure with the attention thresholds and alarm (settable)
- Optical/acoustic alarm signals when the thresholds are reached, and for occurences configured as “serious” level.
- Synoptic panel of the geographical area entirely manageable by the system Administrator, in order to position
any possible additional cabins which may be implemented; the station under alarm blinks and indicates the synchronization status with respect to the remote station; the direction and speed of the wind is represented with a moveable cone indication, the synoptic panel allows to query the station through interactive seleciton.
 - Possibility to set-up the automatic print of one or more reports available in the system.
- File output in ASCII format and in Excel and Word format for each parameter of instantaneous data, minute averages, half-hour averages, daily averages, daily maximums on any chosen period of time.


